Here is a somewhat dated evaluation done at the San Jose Children's Discovery Museum, but I thought their qualitative methods were interested.
http://www.hfrp.org/out-of-school-time/ost-database-bibliography/database/discovery-youth
In the first evaluation, they did focus groups with youth were they divided the youth into teams of 2-3 and had them fill the in the answers to 4 open-ended questions. Then they brought all the teams together (about 4 total) and had them discuss.
In the second evaluation, they did a group activity with program participants. Participants broke out into groups of 4-5. Then they circulated around the room to large pieces of paper with a different question written on each. Each group wrote answers on the large sheet of paper for each question, so they were able to react to a previous group's comments.
These techniques hit on 2 principles that I think are key to focus groups and interviews. First, make it fun. Vary the questions, get people up and moving, use the 5 senses, present extremes with humor.
Second, give them something to react to. I find I get much more detailed and colorful responses from people if I present something to them first and get their feedback on it. A list, a board full of written-on sticky notes, a photo, a written description. In both of the examples above, participants were responding to what other participants said. A key to that, I believe, is to have people commit to an opinion on paper first. If you jump into reactions right away, then less vocal opinions get lost.
Tuesday, July 26, 2011
Tuesday, July 19, 2011
Expanding the Customer Experience - And A Simple Way to Get Started
Most cultural organizations are focusing in on customer experience as a key to long-term success. Visitors who have a good experience, come again, and again. They bring other people, they talk about you, they may even turn from visitors to donors.
But when we think about customer experience, we often do so with blinders on. Let's say you're a history museum. What's the customer experience? A family walks in to the museum, pays admission, visits galleries, maybe interacts with some guides or docents, checks out the gift shop on the way out, and leaves.
With that perspective, how do we improve customer experience? We make sure visitors can easily find the admission desks, we train employees to be friendly and welcoming, we focus on great content in the galleries, we have fun and interesting items in the gift shop.
There are 2 problems with this kind of brainstorming. #1: It is focused on the customer experience from the perspective of the institution only. #2 (and following from #1): It leaves out the Why.
#1. Institution-focused perspective
Think about the experience of going out for ice cream. What does it look like? You pull up to the shop with your family, head inside, look at the many choices, make your selections, pay, eat and enjoy the ice cream, and leave.
Okay, take the first one. You pull up to the shop. Hang on a sec. What happened before you pulled up? Well, you had to decide which ice cream shop to go to. What about before that? You had to decide to take the whole family out to ice cream. Maybe it was a choice between ice cream or a different treat. Maybe this is a routine thing you do on Wednesday nights. Maybe you're celebrating something or someone special.
Now the other side. What happens after you leave? You worry about sticky hands on the car upholstery. You laugh and joke on the way home. Your kids thank you for the outing. You post photos on your blog of the family trip.
Lesson? There's a whole lot more to getting ice cream than what happens at the shop.
As I talked about earlier, you can look at customer experience as having 5 parts: Entice (when people are thinking they want what you have), Enter (investigating you, calling, looking up online), Engage (decided to come or to purchase), Exit (conclude visit or purchase), Extend (think about it, talk about it, want it, later on). Institutions usually focus on the third, Engage. But your customers' experience has already started and will continue after.
#2. Getting at Why.
It's important to recognize this wider range of the customer experience because it will help you think about the why behind your customer engagement. When you think about how people got to you, you start to think about why they came. What situation were they in? What need were they trying to fill? Is it different for different people?
Asking these questions will help you think about what to change once visitors get to the Engage step. It will also help you think about how you can reach your visitors before they get to that step, and what potential their is for extending beyond the engage/exit.
Want to incorporate this thinking in your organization?
Here's a simple strategy to use to get people thinking in these broader terms of the customer experience. On small cards, write down brief sentences describing a typical experience (getting ice cream, buying golf clubs). Include sentences from each of the 5 aspects of the customer experience. Have some of the cards be positive things (found a parking space!) and some be negative things (couldn't figure out how to call customer service). Shuffle the cards up, and have people sort through the cards to put them in order of what they would do in this experience. Once they do this, draw the analogy to your organization. How would you re-write some of the cards for our organization? Push the card up higher if we're doing this well. Push it down lower if we're doing it poorly. What do we need to work on?
Wednesday, July 13, 2011
Experience Economy Frameworks (cont)
Continuing to document the frameworks I learned while talking to Kathy Macdonald.
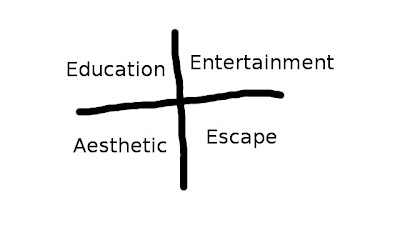
The Values of An Experience
People value 4 basic things in an experience: education (what did I learn? how am I different?), entertainment (did it make me laugh? did it feel fun and interesting?), aesthetic (was it comfortable? was it beautiful?), and escape (did I lose track of time? did I feel like I was somewhere else for a little while?).
Problem vs Pain
When an organization brings on a consultant, it's usually because they've identified some problem they want help dealing with. For example, a museum may say that they want to increase visitors coming through the doors on weekends. That's their problem. But it's worth digging in to what their pain is. Maybe their pain is that their revenue is steadily decreasing. Or they put a lot of resources into weekend programming and aren't seeing a return. The pain gets at why the problem is a problem.
Ways to Change the Experience
When an organization is looking at changing the customer experience, they have 3 ways to go about it. First, the physical environment: what people see when they come and how it makes them feel. Think colors, textures, furniture, light. Second, the process: how people find their way, what they can (and can't do). Think signage, walkways, admissions or reference desks. Finally, human: the people they interact with and how they interact with them. Think front desk staff, docents, guides.
The Change Timeline
When organizations recognize they have a new vision, strategy, or direction to pursue, they often want to get there right away. Practically speaking, change takes time. This framework says 3 years. The yellow scribble at the end of 3 years is the organization's vision of where they want to be. It's a scribble because, while it's got some definition, it's still going to be vague - it will shift and grow and become defined in this 3-year process.

At the beginning of the timeline is the Ending. Organizations often start the vision/strategy process by identifying that there are things they want to stop. Things that aren't working right. Next, they move into Neutral. This is where they are trying new things out (hence the squiggly lines - guess and check, trial and error). They expect some failure, they expect some success. Finally they get to the Beginning. They've identified a few things that work. They move forward, full speed ahead.
The check marks at the bottom are check points for the organization. It's easy to get discouraged and to feel like things are never going to take shape. By making a list of milestones in advance, then organizations can point those out as signs that they're on the right track.
The Values of An Experience
People value 4 basic things in an experience: education (what did I learn? how am I different?), entertainment (did it make me laugh? did it feel fun and interesting?), aesthetic (was it comfortable? was it beautiful?), and escape (did I lose track of time? did I feel like I was somewhere else for a little while?).

Problem vs Pain
When an organization brings on a consultant, it's usually because they've identified some problem they want help dealing with. For example, a museum may say that they want to increase visitors coming through the doors on weekends. That's their problem. But it's worth digging in to what their pain is. Maybe their pain is that their revenue is steadily decreasing. Or they put a lot of resources into weekend programming and aren't seeing a return. The pain gets at why the problem is a problem.
Ways to Change the Experience
When an organization is looking at changing the customer experience, they have 3 ways to go about it. First, the physical environment: what people see when they come and how it makes them feel. Think colors, textures, furniture, light. Second, the process: how people find their way, what they can (and can't do). Think signage, walkways, admissions or reference desks. Finally, human: the people they interact with and how they interact with them. Think front desk staff, docents, guides.
The Change Timeline
When organizations recognize they have a new vision, strategy, or direction to pursue, they often want to get there right away. Practically speaking, change takes time. This framework says 3 years. The yellow scribble at the end of 3 years is the organization's vision of where they want to be. It's a scribble because, while it's got some definition, it's still going to be vague - it will shift and grow and become defined in this 3-year process.

At the beginning of the timeline is the Ending. Organizations often start the vision/strategy process by identifying that there are things they want to stop. Things that aren't working right. Next, they move into Neutral. This is where they are trying new things out (hence the squiggly lines - guess and check, trial and error). They expect some failure, they expect some success. Finally they get to the Beginning. They've identified a few things that work. They move forward, full speed ahead.
The check marks at the bottom are check points for the organization. It's easy to get discouraged and to feel like things are never going to take shape. By making a list of milestones in advance, then organizations can point those out as signs that they're on the right track.
Friday, July 1, 2011
Frameworks for an Experience Economy
I had a fascinating and inspiring discussion yesterday with Kathy Macdonald, and I wanted to capture a few of the takeaways from our conversation here.
Kathy works with businesses to help them be competitive in the Experience Economy. Her work comes from Joseph Pine and James Gilmore's work in that area, best known by their book The Experience Economy (an updated version to be released shortly). She is also a master at putting ideas into frameworks that businesses can use for thinking about problems and coming up with solutions - which is something that I absolutely love and strive to do.
Through the course of our conversation, Kathy shared with me a few interesting frameworks.
First, the 5 phases of a customer: Entice (or Anticipate), Enter, Engage, Exit, Extend. Most businesses think about their customer relations starting at the Engage phase - a customer walks in the door to buy something. However, for the customer the experience starts way before. Take the analogy of buying a new pair of shoes. The customer experience starts when she realizes her old running shoes are wearing thin or her dress shoes are looking out of date - the customer anticipates the need for shoes (or, from the business side, they entice the customer to consider needing shoes). The customer Enters when she picks up a phone to call a shoe store, or finds them on an online search. She Engages when she drives to the store, walks in the door, looks for and finds shoes. She Exits when she buys the shoes, walks out, drives home, and starts wearing the shoes. Extend comes as she realizes the shoes hold up well (or don't), fit well (or don't), or when the store contacts her with a follow up or to give her a coupon or ad.
Thinking about the whole arc of the customer experience really changes the way a business sees their role and their contact points with a customer. It also gives them a sense of what background (or baggage) customers may bring with them once they get to the Engage piece, and what potential there is to Extend.
More frameworks to come later...
Friday, June 17, 2011
Simple tool - Net Promoter Score
Here's a tool that's been around for a while in the business world: Net Promoter Scores. NPS measures loyalty to a business or organization. It's a simple measure. Just ask,
"How likely is it that you would recommend this company to a friend or colleague?"
with an answer scale from 0 (low) to 10 (high).
What I find most interesting about NPS is how to interpret answers.
9-10 = loyal customers (promoters)
7-8 = neutral (generally satisfied, not in love)
6 and under = detractors (send negative messages)
To calculate an actual number for your overall NPS, you take Promoters/All Responses minus Detractors/All Respondents.
See an interesting discussion of application of NPS to Zingerman's: http://www.zingtrain.com/articles/zxi-a-new-way-to-measure-service/
Tuesday, June 14, 2011
US Impact Study - National Research on the Benefits from Internet Access at Public Libraries
The University of Washington Information School recently released findings from the US IMPACT Public Library Study. This was a large-scale national study, funded by IMLS and the Bill & Melinda Gates Foundation, looking at internet use at public libraries.
The data was gathered from an impressive scale of telephone surveys, online surveys via public library computers and case studies/interviews at a few libraries.
The report lays out broad use statistics and demographics, but combines this with insightful and detailed analysis. It's a thought-provoking read (though time-consuming, unless you opt for the executive summary).
I'm a little wary of some of their findings since part of their data comes from people who are already library computer users (the online survey). Evaluation-speak, this is selecting on the dependent variable, which could introduce bias into the results. They did have a substantial sample from the random phone surveys and it looks like they did some creative mathematical weighting to combine the phone and web samples to reduce bias as much as possible. But it's something to keep in mind.
A few findings I found particularly interesting.
Almost 1/3 of Americans used their public library for internet access.

While there is higher use of library internet connections among people in households living below the poverty line (44%, higher for young adults and seniors), "people of all ages, incomes, races, and levels of education go to the library for Internet access, whether they have a connection at home or not". Libraries are still great agents of democracy - computer access is for everyone, used by everyone.

Internet access = young adult access. Young adults (14-18 year olds) are high library computer users. What a great initial step for libraries to involve this traditionally hard-to-reach group.
Patrons rely on library computers to take care of the everyday routine tasks as well as to take life-changes steps.
Library computer access differs from other options for computers and wireless (cafes, etc) because it is truly free (no feeling obligated to buy a drink first), it offers a quiet space for work, and it comes with staff to help navigate all ranges of computer and technology issues.
Library internet users can be segmented into 3 groups. Power users, who use the library as their sole access point and come almost daily. Supplemental users, who use the library internet routinely but have other internet options. Occasional users who use the library interest in an emergency, during a time of transition, or to do the quick occasional task.
Low income patrons are less likely to use library internet access overall, but if they do use it, they are more likely to be very frequent users. Same for 19-24 year olds. Youth 14-18 are the most likely user group of library internet and are also very frequent users.
Thursday, June 2, 2011
New survey resource! All Our Ideas
Check out this nifty new tool for doing a quick survey to rank items: http://www.allourideas.org/

This is a great resource for institutions like museums and libraries that want to poll visitors on potential new services or programs. Imagine one of those staff meetings where you create a wish list of things you'd like to do for your visitors. This list may look something like:
- Validate parking
- Provide more food options in vending/snack area
- Have more staff in exhibit areas to give visitors more information about exhibits
- Install more benches, chairs in gallery areas
- Section off part of the library as a "No Shhhh Zone" that people can use for group work
- Offer story time programs on Saturday mornings
It's great for staff to generate ideas about how to improve visitor services. With All Our Ideas you can quickly take it to the next step and ask visitors to respond to the wish list. The site takes your list and gives visitors 2 of the options from the list and they have to vote for one item over the other (or select "I don't know"). They repeat this process over and over in a matter of seconds or minutes. The data is aggregated to a ranking of options, along with fun visualizations of the data.
A great feature of the tool is that respondents can also add their own idea. That idea is then put into the list to be voted on by others. What a fun way to bring fresh ideas to the table - and have immediate visitor feedback on them.
I will add my cautionary, unsolicited advise about asking visitors for ideas. When you ask visitors for ideas, ask about the things they are experts on, not the things you are an expert on.
For example, if you ask visitors "What kind of programs do you want us to do?", you inevitably gets answers that are way out of your budget, mission, or capacity. But what do you expect? You're the experts in program development - you know the profession and the feasibility. On the other hand, if you ask parents/caregivers "What new play items would you like to see in the baby area?", they can fill you in on the latest trends in baby toys that they talk about every week at playgroup.
Keep visitors talking about what they know about, and you can translate that into exceptional experiences that meet their needs.
Wednesday, June 1, 2011
Report of Impacts of Library Summer Reading Program
Libraries around the country are poised to start their summer reading programs. I just ran into this evaluation report done June 2010 on impacts of library summer reading programs:
The Dominican Study: Public Library Summer Reading Programs Close the Reading Gap (http://www.dom.edu/academics/gslis/downloads/DOM_IMLS_book_2010_FINAL_web.pdf)
The report was done by Susan Roman, Deborah Carran, and Carole Fiore through Dominican University Graduate School of Library & Information Science. It was funded by an IMLS National Leadership Grant.
The study was a much-needed follow up to 30-yr old seminal research on library reading programs and took on the ambitious scope of being a national study, looking at effects of reading programs in several states across the country. The study sample was all 3rd grade students (going into 4th grade) from 11 schools in large and small communities in urban, rural and suburban areas. Schools had to have 50% or more students receiving free/reduced lunch (standard measure for children living poverty). Researchers collected data using surveys of students, teachers, public librarians and school librarians as well as results from the Scholastic Reading Inventory administered before and after summer reading programs.
Because researchers were trying to have a broad, national scale for the study, they were unable to create a carefully controlled environment for the research. The design was causal comparative - there was no control group, students opted into the summer reading programs as they chose, and summer reading programs (as well as the experiences of non-participants) varied.
Results of the research show some great data and insight into the value of summer reading programs as identified by students, parents, teachers and librarians. These groups strongly believe summer reading programs make a difference. Unfortunately, researchers were unable the demonstrate a correlation between participation in summer reading program and increased scores on the Scholastic Reading Inventory (SRI). While students who participated in the program universally scored higher on the pre- and post-tests than students who didn't participate, there was no evidence that the program caused further increase in these already-high scores.
This would have been a real Holy Grail for demonstrated impacts in ways that funders so often want to see. In fact, results actually showed an increase in scores on the SRI for students who did not participate in the summer reading program. This is a puzzling result, since we usually take it for granted that reading levels drop over the summer months. As the researchers point out, they don't know what was going on for non-participants - maybe they were involved in alternative reading programs. Without the ability to control the context more, it's difficult to interpret these results.
I wonder if the researchers dug into the effects of the summer reading program, controlling for socio-economic status. For example, if they looked at SRI scores with participation in the program and socio-economic status as independent variables, along with an interaction term. I'm imagining a regression that looks like:
SRI score = B1(Program Participation) + B2(Socio-economic status) + (Program Participation * Socio-economic status)
My hypothesis is that perhaps there is a differential effect of summer reading programs - they are nice but not necessary for students from high-income families but they are invaluable resources for students from low-income families. This would certainly support the idea of libraries as democratizing agents in communities.
In the end, the researchers call for a more focused, controlled study of summer reading programs to drill down to quantifiable impacts. I am intrigued by their works so far and hope that it goes further.
Subscribe to:
Comments (Atom)